Climate change now measured in dollars
How much cash at risk?
What locations lose the most?
 Alarming climate scenarios used to be physical. Temperatures, tons of CO2, and sea levels go up. Glaciers, reefs, and polar bears go away.
But have you noticed a change? Today the damage from warming is being expressed financially – in dollars and localities.
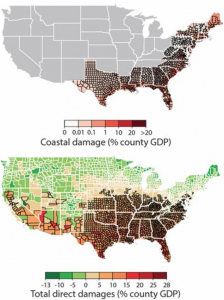
How many dollars? A new study, Estimating economic damage from climate change in the United States, tells us that changes in agriculture, crime, coastal storms, energy, human mortality, and labor will drop GDP an average of 1.2% for every 1°C of warming. Doesn’t sound like much, but 1.2% would cancel out almost all of America’s growth, and 1°C is likely to be exceeded significantly in many places.
Like where? The South. “Risk is distributed unequally across locations, generating a large transfer of value northward and westward that increases economic inequality.” the report says. “By the late 21st century, the poorest third of US counties are projected to experience damages between 2 and 20% of county income (90% chance) under business-as-usual emissions.” By comparison, in the Depression years between 1929 and 1932 worldwide GDP fell an estimated 15%.
Our blog and my book have long emphasized specific dollar costs and specific locations as critical to dodging the effects of warming. We’re glad more voices are joining in to help us think about our expenses, incomes and hometowns.

